Levelling up your project risk management effort to the business level
Projects are how organisations deliver change — and project risk is how organisations lose value. Yet in most organisations, project risk management is a spreadsheet exercise: risks are logged, scored with a traffic-light rating, and reviewed in periodic meetings. The connection to actual business impact, to expected monetary loss, and to the economic case for mitigation, is rarely made explicit.
bossanalytics projectrisk changes this by treating project risk with the same economic rigour that financial controllers bring to capital expenditure. Every risk in your register is assessed not just for likelihood and impact, but for its expected monetary value — the product of probability and financial consequence. This allows you to present your project's risk exposure in terms that senior leadership and sponsors can immediately understand and act upon.
The platform also provides clear guidance on where to spend your mitigation budget. Rather than treating all risks as equally worthy of attention, it shows you which mitigation tasks deliver the best return relative to their cost — giving you a rational, defensible basis for every risk management decision you make.
The U-shaped risk cost curve applies equally to project risk. The optimal mitigation spending point is found at the bottom of the curve — where the combined cost of mitigation and residual risk is minimised.
The Risk Cost principle is as relevant to project management as it is to cyber security. Every project faces risks — uncertainties that could affect its cost, timeline, scope or quality. Mitigating those risks costs money. The question is: how much mitigation is enough?

Too little mitigation and you accept unnecessary exposure to losses — cost overruns, delayed benefits, failed deliverables. Too much, and you are spending more on mitigation than the risks themselves would cost if they materialised. The optimal point is somewhere between these extremes — and it is different for every project and every risk.
bossanalytics projectrisk makes it possible to find this optimal point in practice. By quantifying both the expected cost of each risk and the expected benefit of each mitigation task, the platform calculates your current position on the risk cost curve and shows you where additional investment would be economically justified — and where it would not.
This transforms project risk management from a qualitative, compliance-driven exercise into a genuine decision-support tool for project managers and sponsors who want to make the most of their mitigation budget.
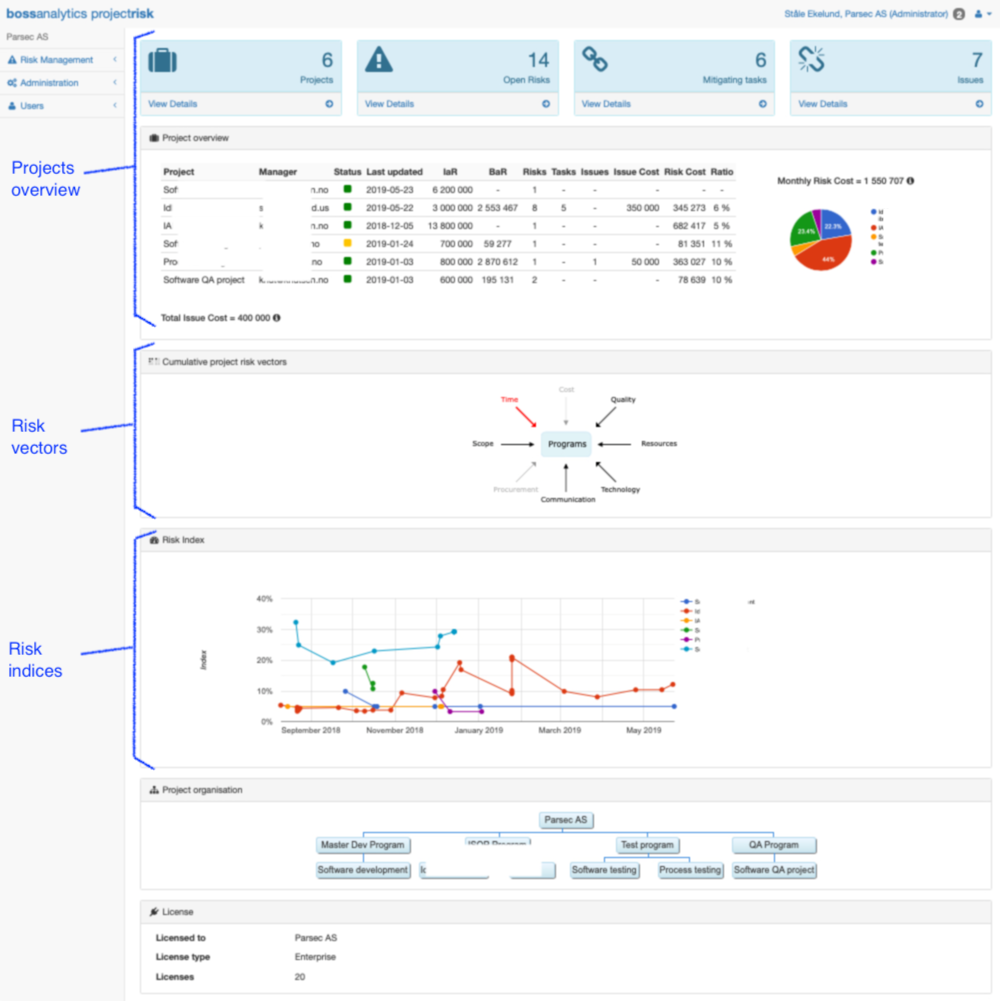
The dashboard gives you an immediate, at-a-glance view of your project's risk status. At the top level, the overview section summarises your total risk exposure, your current mitigation spend, and your residual risk — all expressed in monetary terms so that there is no ambiguity about the scale of the challenge you face.
The risk vector section breaks this summary down by the individual risk categories relevant to your project — schedule risk, resource risk, technical risk, external dependencies, and so on. Each vector shows its expected value, the controls or mitigation tasks in place, and the residual exposure after those mitigations are applied.
The risk index provides a single, composite measure of your project's risk health — a number that can be tracked over time, compared across projects, and used to communicate the overall risk posture of your portfolio to senior leadership. Combined, these three views give every stakeholder the information they need, at the level of detail they require.
Every project exists to deliver benefits — improvements to revenue, efficiency, capability, compliance or risk reduction. Yet in many organisations, the link between project risk management and benefit realisation is weak or absent. Risks are managed in isolation from the benefits they threaten, and the full economic impact of a risk materialising — including the delayed or reduced delivery of expected benefits — is rarely captured.
bossanalytics projectrisk addresses this by integrating benefit tracking directly into the risk management framework. Each project benefit is defined, quantified and linked to the risks that could affect its delivery. When a risk is assessed, its impact is measured not just in terms of cost or schedule, but in terms of the benefits it puts at risk.
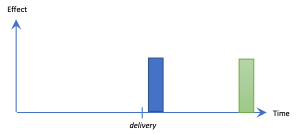
The platform supports both discrete payback — one-time benefits such as a cost saving from retiring a legacy system — and continuous payback — ongoing benefits such as increased revenue from a new capability or sustained efficiency gains from a process improvement. Both types are modelled with the same economic rigour, giving you a complete picture of what your project is designed to deliver and what is at stake if risks are not properly managed.
Effective project risk management is a continuous process — not a one-time workshop at the start of a project. Risks change as the project progresses: new risks emerge, existing risks escalate or diminish, and the effectiveness of mitigations becomes clearer as tasks are completed and evidence accumulates.
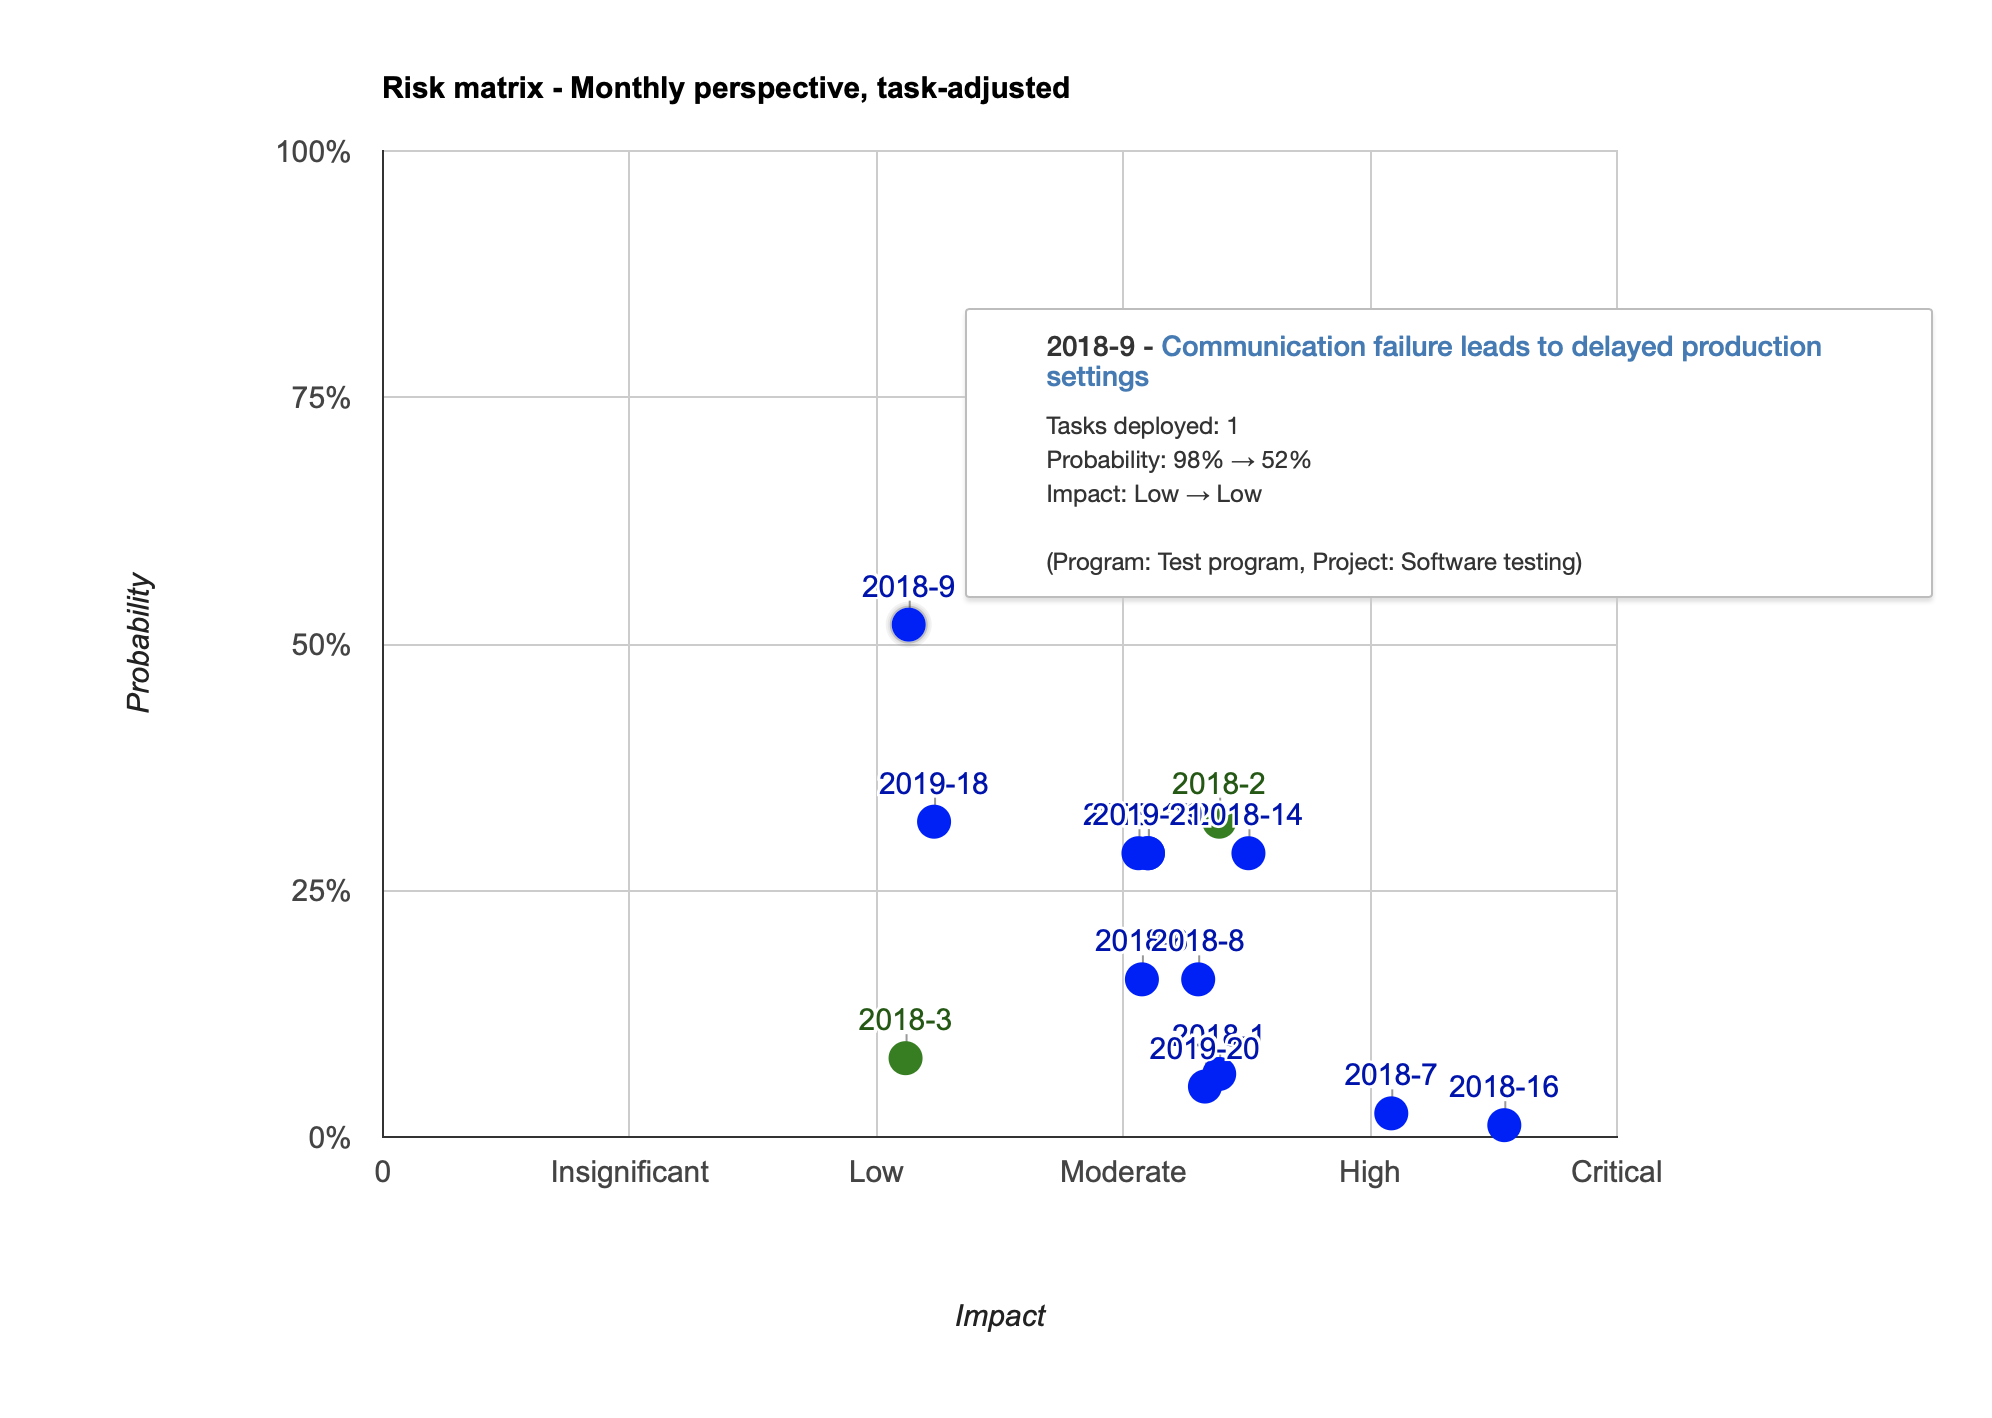
bossanalytics projectrisk supports this continuous process with a risk register that is designed to be maintained throughout the project lifecycle — not just populated and then forgotten. The risk matrix gives you a clear visual representation of where your risks sit in terms of likelihood and impact, making it easy to prioritise attention and communicate the risk landscape to your team and stakeholders.
Identifying and assessing risks is only the beginning. The real work of risk management is in the execution of the mitigation tasks that reduce your exposure — and this is where many organisations struggle. Tasks are assigned, but not tracked. Owners are named, but not held accountable. Progress is reported, but not measured against the actual reduction in risk that the task was designed to achieve.
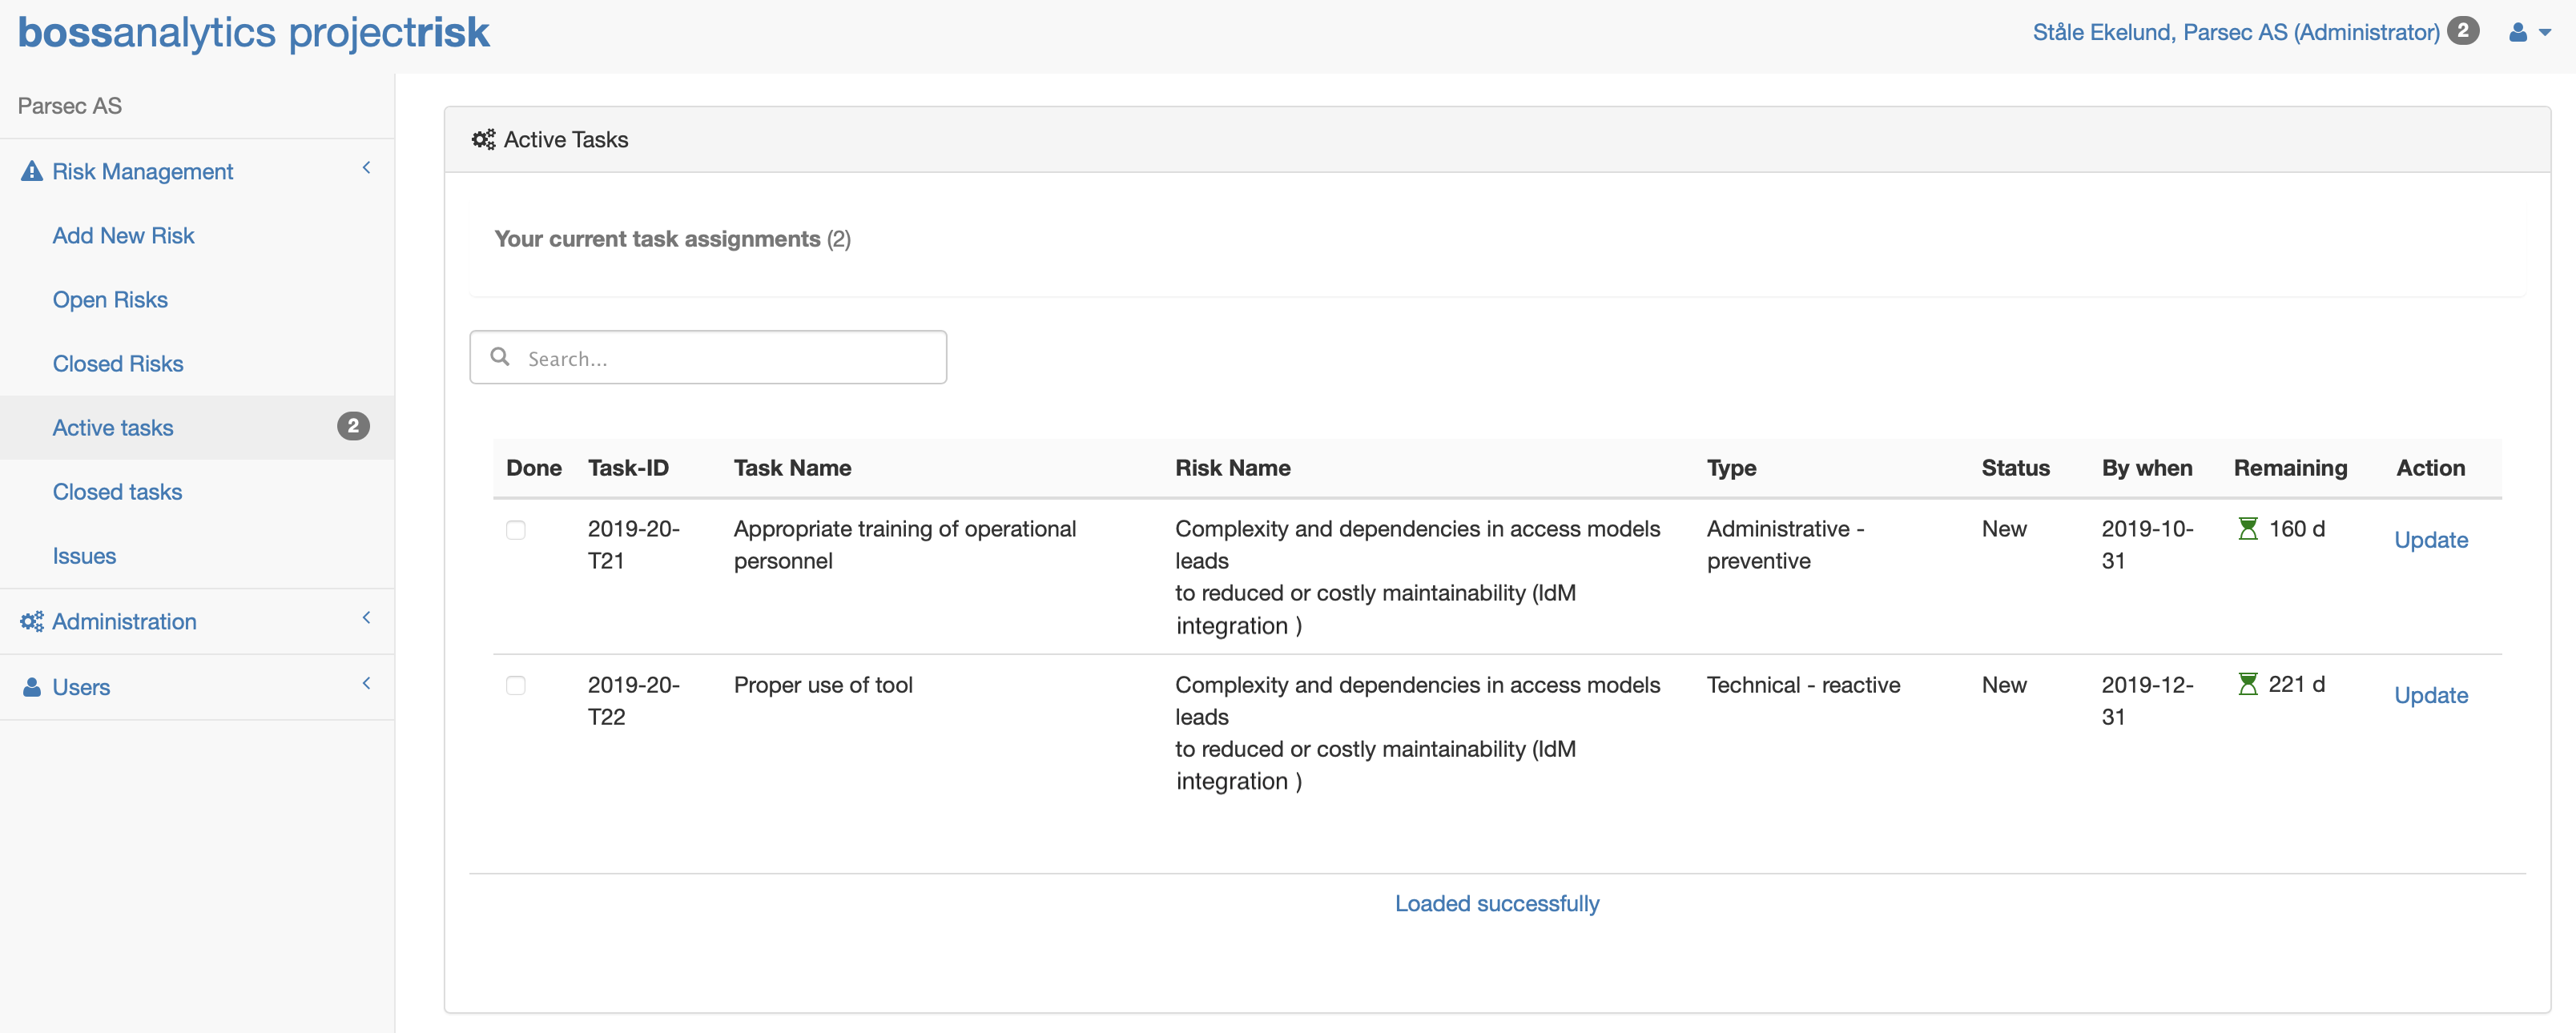
bossanalytics projectrisk includes a full task flow engine that connects every mitigation task directly to the risk it addresses. Each task has a clear owner, a defined timeline, a cost, and an expected risk reduction. As tasks are completed, the platform automatically recalculates your residual risk — giving you a live, accurate picture of your project's risk exposure at every point in the project lifecycle.
The task view gives project managers complete oversight of the mitigation programme — what has been done, what is in progress, what is overdue, and what the overall effect has been on your risk position. This closes the loop between risk identification and risk treatment, turning your risk register from a static document into a dynamic management tool.